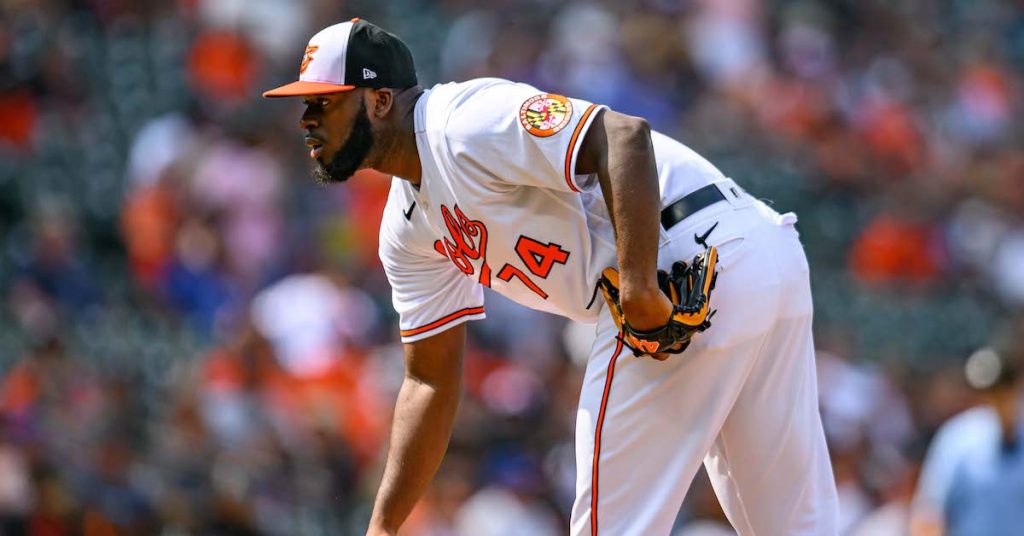

Look at the top of the leaguewide standings and you’ll find both types of elite teams: First, the Braves, an all-conquering, all-chewing-up-and-spitting-out combine harvester that sits atop the standings. After them: an Orioles club that’s outplaying its Pythagorean record by eight games.
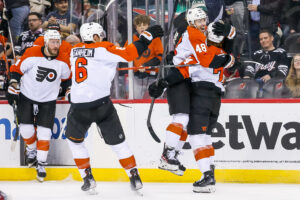
That’s not to take anything away from the Orioles, who are dogwalking the hardest division in baseball thanks to a dizzying collection of talented young hitters and the best bullpen in the sport. Besides, they don’t ask how — they ask how many. But this is yet another reboot of a classic from the generation prior; in 2012, the O’s romped to the playoffs with a 93–69 record and the run differential of an 82–80 team. Now they’re doing the same thing, with Félix Bautista as Jim Johnson, Gunnar Henderson as Manny Machado, and Kyle Bradish as… Wei-Yin Chen, I guess?
It’s not just the Orioles: the Marlins (minus-37 run differential) are beating the Cubs (plus-62) to the last Wild Card spot. The Brewers are 10 games over .500 with the run differential of a .500 team. Every year, it seems like a low-payroll team with a good bullpen smashes its expected record to smithereens and barges into the playoffs. Is there an actual pattern here, or is this just trivia?
Since 2001, 83 teams have outplayed their Pythagorean record by five wins or more. Nobody did it last year, but it’s happened in every other season of the sample, including 2020, when the Marlins beat their run differential by five wins in a 60-game season, and this year, as the Orioles are up by eight, the Marlins by six, and the Brewers by five. (All stats are current through Tuesday.) Sure enough, all three teams are recidivists; the 2018 and ’20 Marlins, the ’12 and ’16 Orioles, and the ’11, ’18, and ’19 Brewers all appear on the list. These three franchises account for 12% of the list and nearly a quarter of the entries since ’11.
We tend to think of these teams as flukes, and sometimes that’s true. Other times, as is the case with the 2001 Mariners or 2004 Cardinals, beating the run differential elevates an already great team to another level.
How do you get more wins than your run differential would predict? Well, you have to make the runs scored count for more. The first place to look is a lopsided record in one-run games; indeed, this year’s Orioles, Marlins, and Brewers all have better records in one-run games than they do overall. The Marlins are on a 115-win pace in one-run games and a 70-win pace otherwise. Of the 83 teams to go plus-five wins in the past 23 seasons, 77 have had a .500 record or better in one-run games.
It’s not just about breaking even in one-run games, though; it’s about getting further over break-even than in other games. But while there is a correlation between a high win percentage in one-run games and a team overperforming its run differential, at least in this biased sample, that correlation isn’t particularly strong:

Going through the 83-team sample manually, the thing that sticks out, from a remembering-some-guys perspective, is that so many of these teams are identified with great bullpens or even great individual closers. The killer mid-2010s Royals bullpens show up here. Six Mariano Rivera teams are on the list. The Twins beat their run differential by five runs or more three years running from 2002 to ’04, when their closers were Eddie Guardado and Joe Nathan. Overall, of the 83 teams in the sample, 43 had bullpens that were top 10 in the league in WAR as a unit.
WAR, however, is a context-independent stat, and beating the team’s run differential isn’t about accumulating value; it’s about distributing it in the right places. Since 2001, the team with the best bullpen in baseball (according to WAR) has beaten its expected record by five wins or more three times. The no. 2 bullpen has done it six times, the no. 3 team has done it seven times. But if you measure by win probability added, the no. 1 bullpen in baseball has gone plus-five over its expected record 13 times. By WPA, 38 of the 83 teams in this sample had top-five bullpens in the league.
What these teams tended to have in common was that they ranked higher in WPA than in WAR. Fifty-four of the 83 teams had a better league ranking in bullpen WPA than bullpen WAR. And while relief pitchers chalk up WPA in the highest-leverage spots — i.e., where one run counts the most — the ratio is almost exactly the same for position players: 55 out of 83 teams had a better position player WPA than WAR.
Plus-5 Win Teams by League Rank
| Team | Bullpen WAR | Bullpen WPA | Pos. Player WAR | Pos. Player WPA |
|---|---|---|---|---|
| MIL | 17 | 1 | 19 | 24 |
| BAL | 1 | 4 | 14 | 5 |
| MIA | 10 | 16 | 22 | 15 |
The Orioles are following the most obvious path to beating their run differential: an outstanding bullpen and a position player group that’s always decent but especially good in the clutch. The Brewers, hilariously, have a below-average bullpen overall but the no. 1 bullpen WPA in baseball. Having Devin Williams and Joel Payamps, along with a decent idea of who your mop-up guys are, will have that effect.
With that said, I have absolutely no idea how the Marlins are doing what they’re doing. Good luck to them.
Whether a team outperforms its run differential is a matter of trivia. It only matters if the team in question makes the playoffs. And because a discrepancy between record and run differential can happen anywhere in the standings, that isn’t always the case. Out of the 80 teams on the list whose fates have already been determined, 18 made the playoffs because they outperformed their run differential:
Plus-5-Win Teams’ Fates
| Real Life | Using Pythagorean Record | ||
|---|---|---|---|
| 48 | 32 | 30 | 50 |
This can lead to some bad beats in the playoff race. In 2005, the best run differential in the AL belonged to Cleveland, who missed the playoffs when three of the four spots available went to teams that beat their Pythagorean record by five wins or more. Amazingly, if the 82–80 Padres had played down to their run differential, they still would’ve earned a one-game playoff with the second-place Diamondbacks, who finished 77–85. Or how about this one: the Mariners are responsible for the biggest overperformance of a run differential since 2001 (14 games in 2021), three of the 10 biggest overperformances, and four of the biggest 15. None of those overperformances resulted in the Mariners making the playoffs.
A couple of surplus wins can also have a deleterious effect on the franchise. Last decade, three teams in a row — the 2015 Braves, the 2016 Phillies, and the 2017 Padres — had a run differential bad enough to give them the worst record in baseball, and by extension the top pick in the following year’s draft. But all three teams were so lucky and/or clutch that they played themselves out of that pick. The Padres were 12 games better than their run differential in 2017, dropping them from first in the draft all the way to seventh. (The Padres are currently underperforming their run differential by a league-high nine games. If they could use their Pythagorean record, they’d be in the first NL Wild Card spot.)
Not that that’s any consolation to the Padres, who are getting the wrong end of run differential variance for the second time in six seasons. Maybe they should look into trading for the Marlins’ luck.